mirror of
https://github.com/Unleash/unleash.git
synced 2025-09-19 17:52:45 +02:00
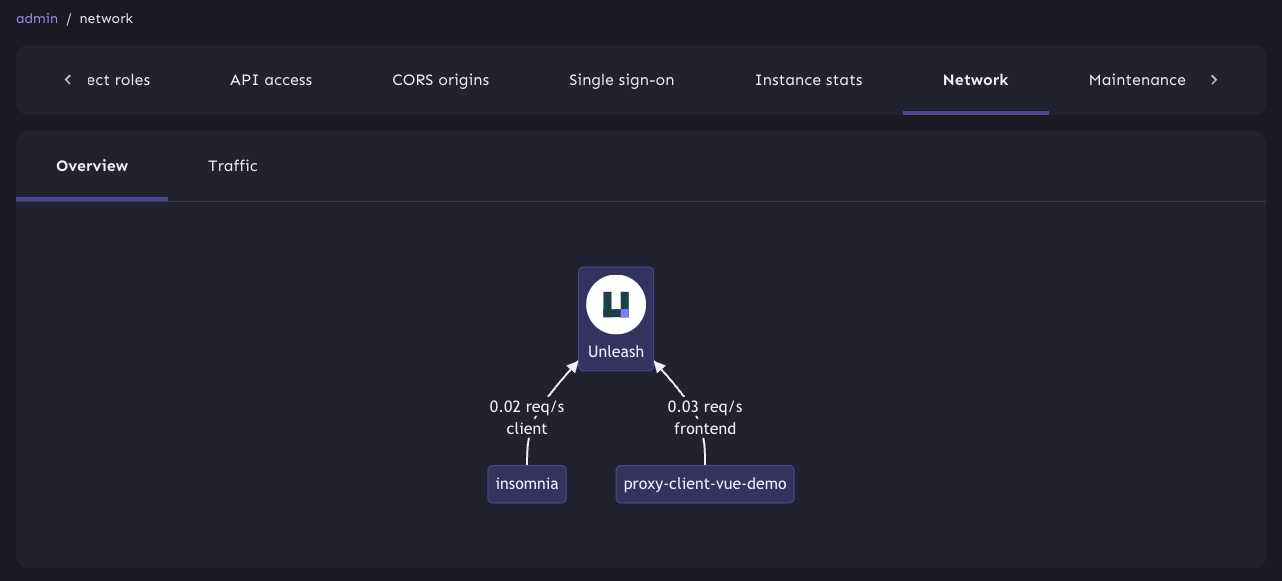
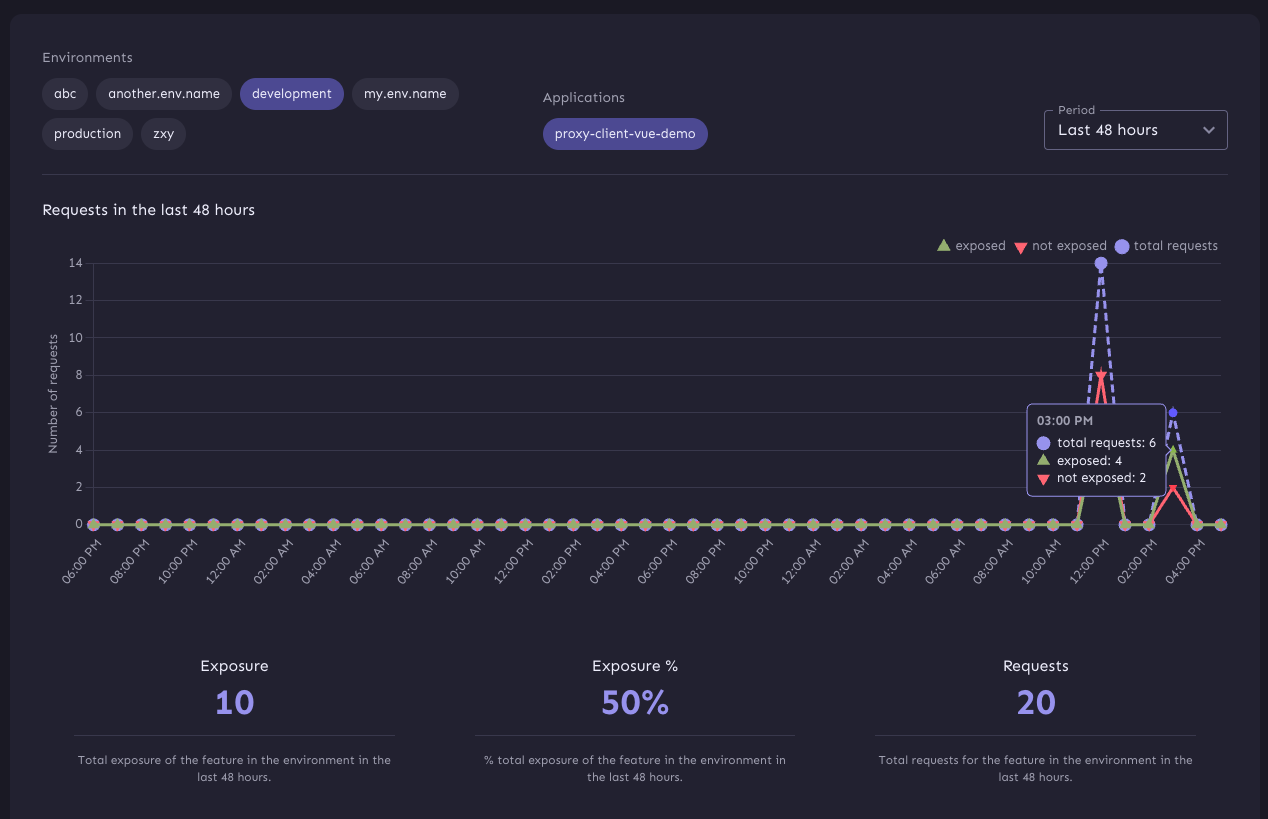
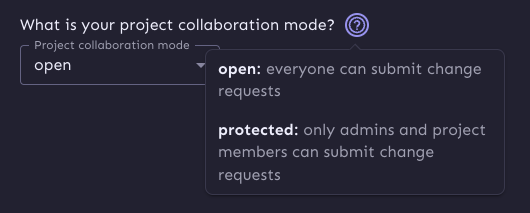
https://linear.app/unleash/issue/2-849/dark-mode-ui-fixes    Also includes misc UI fixes and improvements we identified along the way. Co-authored by @NicolaeUnleash --------- Co-authored-by: NicolaeUnleash <103567375+NicolaeUnleash@users.noreply.github.com>
239 lines
6.9 KiB
TypeScript
239 lines
6.9 KiB
TypeScript
import { useInstanceMetrics } from 'hooks/api/getters/useInstanceMetrics/useInstanceMetrics';
|
|
import { useMemo, VFC } from 'react';
|
|
import { Line } from 'react-chartjs-2';
|
|
import {
|
|
CategoryScale,
|
|
Chart as ChartJS,
|
|
ChartDataset,
|
|
ChartOptions,
|
|
Legend,
|
|
LinearScale,
|
|
LineElement,
|
|
PointElement,
|
|
TimeScale,
|
|
Title,
|
|
Tooltip,
|
|
} from 'chart.js';
|
|
import {
|
|
ILocationSettings,
|
|
useLocationSettings,
|
|
} from 'hooks/useLocationSettings';
|
|
import { formatDateHM } from 'utils/formatDate';
|
|
import { RequestsPerSecondSchema } from 'openapi';
|
|
import 'chartjs-adapter-date-fns';
|
|
import { Alert, useTheme } from '@mui/material';
|
|
import { Box } from '@mui/system';
|
|
import { CyclicIterator } from 'utils/cyclicIterator';
|
|
import { ConditionallyRender } from 'component/common/ConditionallyRender/ConditionallyRender';
|
|
import { usePageTitle } from 'hooks/usePageTitle';
|
|
import { unknownify } from 'utils/unknownify';
|
|
import { Theme } from '@mui/material/styles/createTheme';
|
|
|
|
const pointStyles = ['circle', 'rect', 'rectRounded', 'rectRot', 'triangle'];
|
|
|
|
interface IPoint {
|
|
x: number;
|
|
y: number;
|
|
}
|
|
|
|
type ChartDatasetType = ChartDataset<'line', IPoint[]>;
|
|
|
|
type ResultValue = [number, string];
|
|
|
|
const createChartPoints = (
|
|
values: ResultValue[],
|
|
y: (m: string) => number
|
|
): IPoint[] => {
|
|
return values.map(row => ({
|
|
x: row[0],
|
|
y: y(row[1]),
|
|
}));
|
|
};
|
|
|
|
const createInstanceChartOptions = (
|
|
theme: Theme,
|
|
locationSettings: ILocationSettings
|
|
): ChartOptions<'line'> => ({
|
|
locale: locationSettings.locale,
|
|
responsive: true,
|
|
maintainAspectRatio: false,
|
|
interaction: {
|
|
mode: 'index',
|
|
intersect: false,
|
|
},
|
|
color: theme.palette.text.secondary,
|
|
plugins: {
|
|
tooltip: {
|
|
backgroundColor: theme.palette.background.paper,
|
|
bodyColor: theme.palette.text.primary,
|
|
titleColor: theme.palette.action.active,
|
|
borderColor: theme.palette.primary.main,
|
|
borderWidth: 1,
|
|
padding: 10,
|
|
boxPadding: 5,
|
|
usePointStyle: true,
|
|
callbacks: {
|
|
title: items =>
|
|
formatDateHM(
|
|
1000 * items[0].parsed.x,
|
|
locationSettings.locale
|
|
),
|
|
},
|
|
itemSort: (a, b) => b.parsed.y - a.parsed.y,
|
|
},
|
|
legend: {
|
|
position: 'bottom',
|
|
align: 'start',
|
|
labels: {
|
|
boxWidth: 10,
|
|
boxHeight: 10,
|
|
usePointStyle: true,
|
|
padding: 24,
|
|
},
|
|
},
|
|
title: {
|
|
text: 'Top 10 requests per second in the last 6 hours',
|
|
position: 'top',
|
|
align: 'start',
|
|
display: true,
|
|
font: {
|
|
size: 16,
|
|
weight: '400',
|
|
},
|
|
color: theme.palette.text.primary,
|
|
padding: {
|
|
bottom: 32,
|
|
},
|
|
},
|
|
},
|
|
scales: {
|
|
y: {
|
|
type: 'linear',
|
|
title: {
|
|
display: true,
|
|
text: 'Requests per second',
|
|
color: theme.palette.text.secondary,
|
|
},
|
|
// min: 0,
|
|
suggestedMin: 0,
|
|
ticks: { precision: 0, color: theme.palette.text.secondary },
|
|
grid: {
|
|
color: theme.palette.divider,
|
|
borderColor: theme.palette.divider,
|
|
},
|
|
},
|
|
x: {
|
|
type: 'time',
|
|
time: { unit: 'minute' },
|
|
grid: {
|
|
display: true,
|
|
color: theme.palette.divider,
|
|
borderColor: theme.palette.divider,
|
|
},
|
|
ticks: {
|
|
callback: (_, i, data) =>
|
|
formatDateHM(data[i].value * 1000, locationSettings.locale),
|
|
},
|
|
},
|
|
},
|
|
});
|
|
|
|
class ItemPicker<T> {
|
|
private items: CyclicIterator<T>;
|
|
private picked: Map<string, T> = new Map();
|
|
constructor(items: T[]) {
|
|
this.items = new CyclicIterator<T>(items);
|
|
}
|
|
|
|
public pick(key: string): T {
|
|
if (!this.picked.has(key)) {
|
|
this.picked.set(key, this.items.next());
|
|
}
|
|
return this.picked.get(key)!;
|
|
}
|
|
}
|
|
|
|
const toChartData = (
|
|
theme: Theme,
|
|
rps?: RequestsPerSecondSchema
|
|
): ChartDatasetType[] => {
|
|
if (rps?.data?.result) {
|
|
const colorPicker = new ItemPicker([
|
|
theme.palette.success,
|
|
theme.palette.error,
|
|
theme.palette.primary,
|
|
theme.palette.warning,
|
|
]);
|
|
return rps.data.result.map((dataset, i) => {
|
|
const endpoint = unknownify(dataset.metric?.endpoint);
|
|
const appName = unknownify(dataset.metric?.appName);
|
|
const color = colorPicker.pick(endpoint);
|
|
const values = (dataset.values || []) as ResultValue[];
|
|
return {
|
|
label: `${endpoint}: ${appName}`,
|
|
borderColor: color.main,
|
|
backgroundColor: color.main,
|
|
data: createChartPoints(values, y => parseFloat(y)),
|
|
elements: {
|
|
point: {
|
|
radius: 4,
|
|
pointStyle: pointStyles[i % pointStyles.length],
|
|
},
|
|
line: {
|
|
borderDash: [8, 4],
|
|
},
|
|
},
|
|
};
|
|
});
|
|
}
|
|
return [];
|
|
};
|
|
|
|
export const NetworkTraffic: VFC = () => {
|
|
const { locationSettings } = useLocationSettings();
|
|
const { metrics } = useInstanceMetrics();
|
|
const theme = useTheme();
|
|
const options = useMemo(() => {
|
|
return createInstanceChartOptions(theme, locationSettings);
|
|
}, [theme, locationSettings]);
|
|
|
|
usePageTitle('Network - Traffic');
|
|
|
|
const data = useMemo(() => {
|
|
return { datasets: toChartData(theme, metrics) };
|
|
}, [theme, metrics, locationSettings]);
|
|
|
|
return (
|
|
<ConditionallyRender
|
|
condition={data.datasets.length === 0}
|
|
show={<Alert severity="warning">No data available.</Alert>}
|
|
elseShow={
|
|
<Box sx={{ display: 'grid', gap: 4 }}>
|
|
<div style={{ height: 400 }}>
|
|
<Line
|
|
data={data}
|
|
options={options}
|
|
aria-label="An instance metrics line chart with two lines: requests per second for admin API and requests per second for client API"
|
|
/>
|
|
</div>
|
|
</Box>
|
|
}
|
|
/>
|
|
);
|
|
};
|
|
|
|
// Register dependencies that we need to draw the chart.
|
|
ChartJS.register(
|
|
CategoryScale,
|
|
LinearScale,
|
|
PointElement,
|
|
LineElement,
|
|
TimeScale,
|
|
Legend,
|
|
Tooltip,
|
|
Title
|
|
);
|
|
|
|
// Use a default export to lazy-load the charting library.
|
|
export default NetworkTraffic;
|