mirror of
https://github.com/Unleash/unleash.git
synced 2025-11-24 20:06:55 +01:00
This commit adjusts the height of the flag section in the personal dashboard, so that the chart doesn't cause scrolling on the widest version. Before: 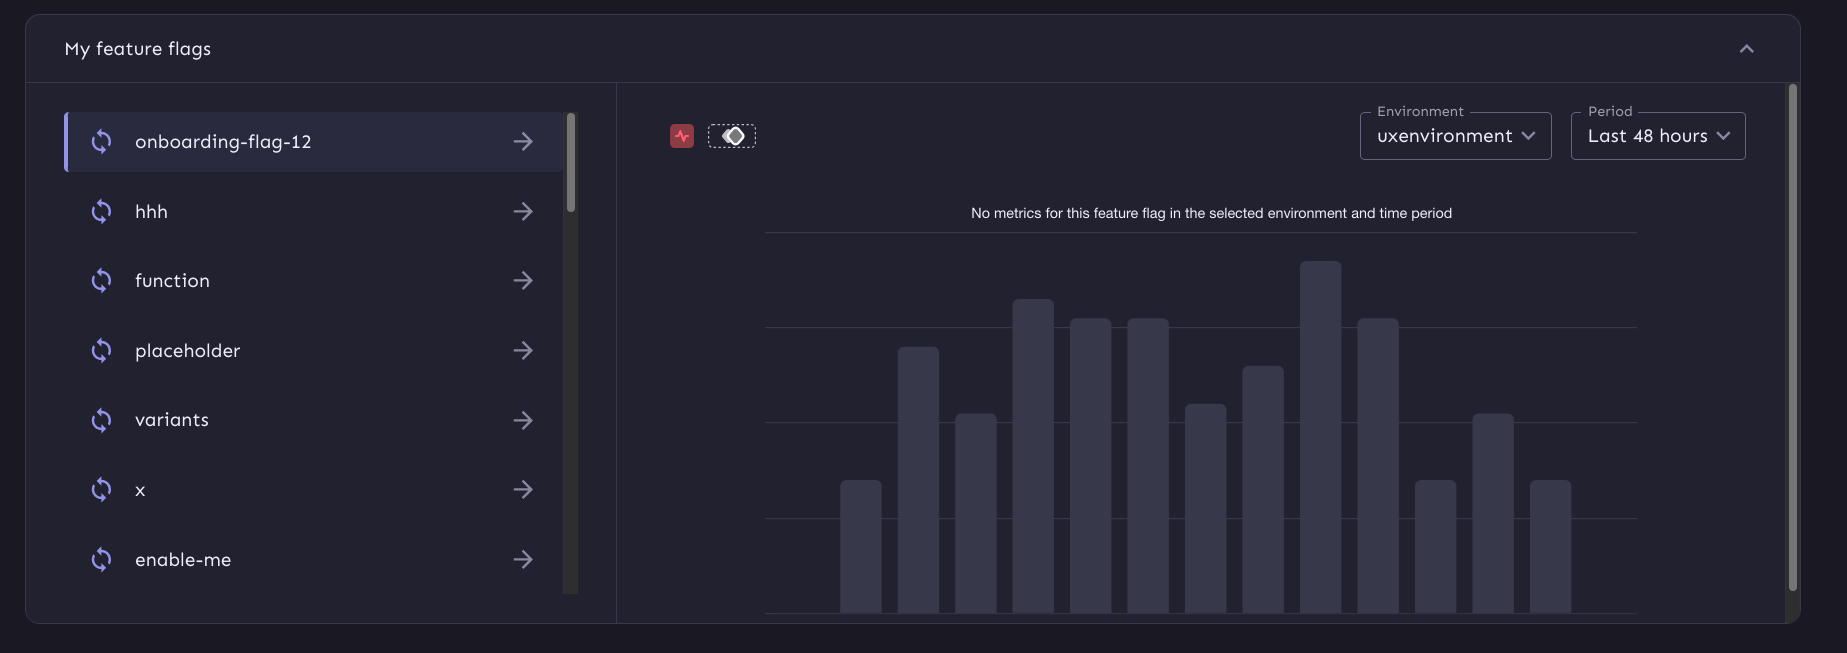 After:  Also fixes some issues in regards to super big lists when it goes into flex mode and makes the chart more responsive
189 lines
5.9 KiB
TypeScript
189 lines
5.9 KiB
TypeScript
import type { Theme } from '@mui/material/styles/createTheme';
|
|
import type { ChartOptions } from 'chart.js';
|
|
import type { ILocationSettings } from '../../hooks/useLocationSettings';
|
|
import type { IPoint } from '../feature/FeatureView/FeatureMetrics/FeatureMetricsChart/createChartData';
|
|
import {
|
|
formatDateHM,
|
|
formatDateYMD,
|
|
formatDateYMDHM,
|
|
} from '../../utils/formatDate';
|
|
import { formatTickValue } from 'component/common/Chart/formatTickValue';
|
|
|
|
const formatVariantEntry = (
|
|
variant: [string, number],
|
|
totalExposure: number,
|
|
) => {
|
|
if (totalExposure === 0) return '';
|
|
const [key, value] = variant;
|
|
const percentage = Math.floor((Number(value) / totalExposure) * 100);
|
|
return `${value} (${percentage}%) - ${key}`;
|
|
};
|
|
|
|
export const createPlaceholderBarChartOptions = (
|
|
theme: Theme,
|
|
): ChartOptions<'bar'> => ({
|
|
plugins: {
|
|
legend: {
|
|
position: 'top',
|
|
labels: {
|
|
color: theme.palette.text.primary,
|
|
usePointStyle: true,
|
|
pointStyle: 'none',
|
|
boxHeight: 0,
|
|
padding: 15,
|
|
boxPadding: 5,
|
|
},
|
|
},
|
|
|
|
tooltip: {
|
|
enabled: false,
|
|
},
|
|
},
|
|
responsive: true,
|
|
maintainAspectRatio: false,
|
|
scales: {
|
|
x: {
|
|
stacked: true,
|
|
ticks: {
|
|
display: false,
|
|
},
|
|
grid: {
|
|
display: false,
|
|
},
|
|
},
|
|
y: {
|
|
stacked: true,
|
|
ticks: {
|
|
maxTicksLimit: 5,
|
|
display: false,
|
|
},
|
|
grid: {
|
|
drawBorder: false,
|
|
color: theme.palette.divider,
|
|
},
|
|
},
|
|
},
|
|
elements: {
|
|
bar: {
|
|
borderRadius: 5,
|
|
},
|
|
},
|
|
interaction: {
|
|
mode: 'index',
|
|
intersect: false,
|
|
},
|
|
});
|
|
|
|
export const createBarChartOptions = (
|
|
theme: Theme,
|
|
hoursBack: number,
|
|
locationSettings: ILocationSettings,
|
|
): ChartOptions<'bar'> => {
|
|
const { responsive, elements, interaction, scales, maintainAspectRatio } =
|
|
createPlaceholderBarChartOptions(theme);
|
|
return {
|
|
plugins: {
|
|
legend: {
|
|
position: 'bottom',
|
|
labels: {
|
|
color: theme.palette.text.primary,
|
|
pointStyle: 'circle',
|
|
usePointStyle: true,
|
|
boxHeight: 6,
|
|
padding: 15,
|
|
boxPadding: 5,
|
|
},
|
|
},
|
|
|
|
// required to avoid the highlight plugin highlighting empty annotation
|
|
annotation: {
|
|
clip: false,
|
|
annotations: {},
|
|
},
|
|
tooltip: {
|
|
backgroundColor: theme.palette.background.paper,
|
|
titleColor: theme.palette.text.primary,
|
|
bodyColor: theme.palette.text.primary,
|
|
bodySpacing: 6,
|
|
padding: {
|
|
top: 20,
|
|
bottom: 20,
|
|
left: 30,
|
|
right: 30,
|
|
},
|
|
borderColor: 'rgba(0, 0, 0, 0.05)',
|
|
borderWidth: 3,
|
|
usePointStyle: true,
|
|
caretSize: 0,
|
|
boxPadding: 10,
|
|
callbacks: {
|
|
label: (item) => {
|
|
return `${item.formattedValue} - ${item.dataset.label}`;
|
|
},
|
|
afterLabel: (item) => {
|
|
const data = item.dataset.data[
|
|
item.dataIndex
|
|
] as unknown as IPoint;
|
|
|
|
if (
|
|
item.dataset.label !== 'Exposed' ||
|
|
data.variants === undefined
|
|
) {
|
|
return '';
|
|
}
|
|
const { disabled, ...actualVariants } = data.variants;
|
|
return Object.entries(actualVariants)
|
|
.map((entry) => formatVariantEntry(entry, data.y))
|
|
.join('\n');
|
|
},
|
|
title: (items) => {
|
|
return `Time: ${
|
|
hoursBack > 48
|
|
? formatDateYMDHM(
|
|
items[0].label,
|
|
locationSettings.locale,
|
|
'UTC',
|
|
)
|
|
: formatDateHM(
|
|
items[0].label,
|
|
locationSettings.locale,
|
|
)
|
|
}`;
|
|
},
|
|
},
|
|
},
|
|
},
|
|
responsive,
|
|
maintainAspectRatio,
|
|
scales: {
|
|
x: {
|
|
...(scales ? scales.x : {}),
|
|
ticks: {
|
|
color: theme.palette.text.secondary,
|
|
callback(tickValue) {
|
|
const label = this.getLabelForValue(Number(tickValue));
|
|
return hoursBack > 48
|
|
? formatDateYMD(
|
|
label,
|
|
locationSettings.locale,
|
|
'UTC',
|
|
)
|
|
: formatDateHM(label, locationSettings.locale);
|
|
},
|
|
},
|
|
},
|
|
y: {
|
|
...(scales?.y ?? {}),
|
|
ticks: {
|
|
...(scales?.y?.ticks ?? {}),
|
|
color: theme.palette.text.secondary,
|
|
callback: formatTickValue,
|
|
display: true,
|
|
},
|
|
},
|
|
},
|
|
elements,
|
|
interaction,
|
|
};
|
|
};
|