mirror of
https://github.com/Unleash/unleash.git
synced 2025-11-10 01:19:53 +01:00
This makes the width of the highlight bars in the network dynamic and based on the number of labels included in the chart. Since the number of labels should always correspond to the number of data points, this seems like a sensible approach. With this, the label width will now be calculated on the fly, so even if you resize the window or change the number of labels, the highlighting will still work as expected. Daily view: 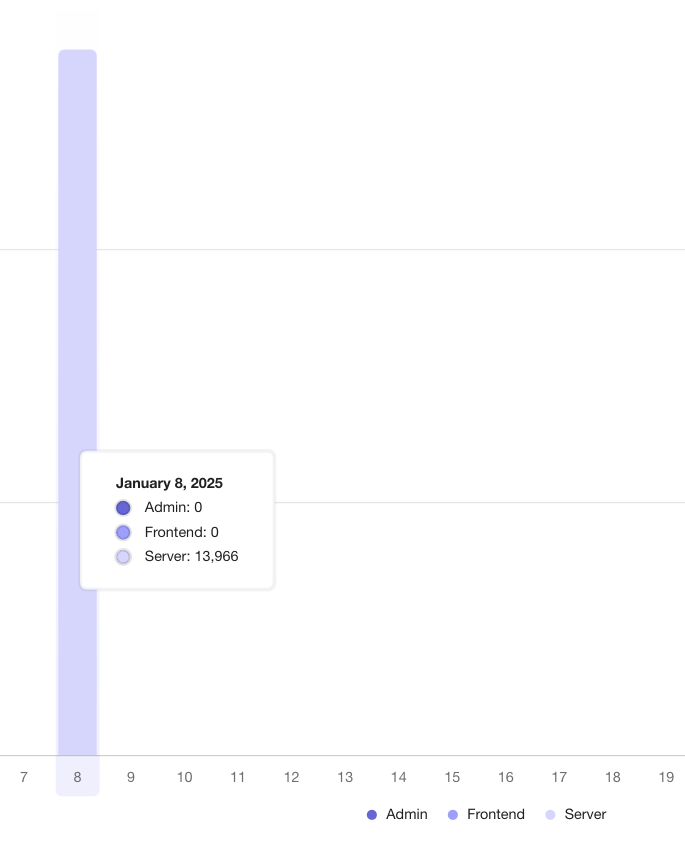 Monthly aggregate: 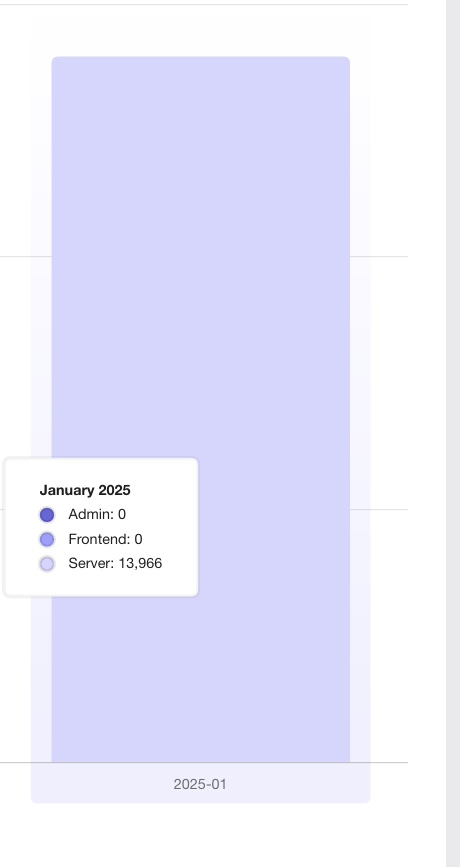 The labels are now a little narrower on the daily graphs, but it avoids them being super wide on the monthly graphs |
||
|---|---|---|
| .. | ||
| __mocks__ | ||
| assets | ||
| component | ||
| constants | ||
| contexts | ||
| hooks | ||
| interfaces | ||
| openapi | ||
| themes | ||
| types | ||
| utils | ||
| index.tsx | ||
| setupTests.ts | ||
| vite-env.d.ts | ||