We are observing incorrect data in Prometheus, which is consistently
non-reproducible. After a restart, the issue does not occur, but if the
pods run for an extended period, they seem to enter a strange state
where the counters become entangled and start sharing arbitrary values
that are added to the counters.

For example, the `feature_lifecycle_stage_entered` counter gets an
arbitrary value, such as 12, added when `inc()` is called. The
`exceedsLimitErrorCounter` shows the same behavior, and the code
implementation is identical.

We also tested some existing `increase()` counters, and they do not
suffer from this issue.

All calls to `counter.labels(labels).inc(`) will be replaced by
`counter.increment()` to try to mitigate the issue.
Previously we expected the tag to look like `type:value`. Now we allow
everything after first colon, as the value and not break query
`type:this:still:is:value`.
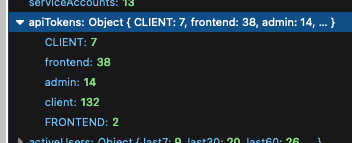
Fixes a bug where if you had API keys using different casing for the
same type, they'd come out as different types in the API token count
map. To get around it, we normalize the keys to lowercase before
inserting them into the map, taking into account any previous values
that might have existed for that type.
Should fix issues like this:
Updates the instance stats endpoint with
- maxEnvironmentStrategies
- maxConstraints
- maxConstraintValues
It adds the following rows to the front end table:
- segments (already in the payload, just not used for the table before)
- API tokens (separate rows for type, + one for total) (also existed
before, but wasn't listed)
- Highest number of strategies used for a single flag in a single
environment
- Highest number of constraints used on a single strategy
- Highest number of values used for a single constraint

Turns out we've been trying to return API token data in instance stats
for a while, but that the serialization has failed. Serializing a JS map
just yields an empty object.

This PR fixes that serialization and also adds API tokens to the
instance stats schema (it wasn't before, but we did return it). Adding
it to the schema is also part of making resource usage visible as part
of the soft limits project.
Path types in our openapi are inferred as string (which is a sensible
default). But we can be more specific and provide the right type for
each parameter. This is one example of how we can do that
This PR fixes an issue where the number of flags belonging to a project
was wrong in the new getProjectsForAdminUi.

The cause was that we now join with the events table to get the most
"lastUpdatedAt" data. This meant that we got multiple rows for each
flag, so we counted the same flag multiple times. The fix was to use a
"distinct".

Additionally, I used this as an excuse to write some more tests that I'd
been thinking about. And in doing so also uncovered another bug that
would only ever surface in verrry rare conditions: if a flag had been
created in project A, but moved to project B AND the
feature-project-change event hadn't fired correctly, project B's last
updated could show data from that feature in project A.

I've also taken the liberty of doing a little bit of cleanup.
## About the changes
When storing last seen metrics we no longer validate at insert time that
the feature exists. Instead, there's a job cleaning up on a regular
interval.

Metrics for features with more than 255 characters, makes the whole
batch to fail, resulting in metrics being lost.

This PR helps mitigate the issue while also logs long name feature names
Implements empty responses for the fake project read model. Instead of
throwing a not implemented error, we'll return empty results.

This makes some of the tests in enterprise pass.
This PR touches up a few small things in the project read model.

Fixes:
Use the right method name in the query/method timer for
`getProjectsForAdminUi`. I'd forgotten to change the timer name from the
original method name.

Spells the method name correctly for the `getMembersCount` timer (it
used to be `getMemberCount`, but the method is callled `getMembersCount`
with a plural s).

Changes:
Call the `getMembersCount` timer from within the `getMembersCount`
method itself. Instead of setting that timer up from two different
places, we can call it in the method we're timing. This wasn't a problem
previously, because the method was only called from a single place.
Assuming we always wanna time that query, it makes more sense to put the
timing in the actual method.
Hooks up the new project read model and updates the existing project
service to use it instead when the flag is on.

In doing:
- creates a composition root for the read model
- includes it in IUnleashStores
- updates some existing methods to accept either the old or the new
model
- updates the OpenAPI schema to deprecate the old properties
These are both related to the work on the project list improvements
project.

The `projectListImprovements` flag will be used to enable disable the
new project list improvements.

The `useProjectReadModel` flag will be used to enable/disable the use
of the new project read model and is mostly a safety feature.
Creates a new project read model exposing data to be used for the UI and
for the insights module.

The model contains two public methods, both based on the project store's
`getProjectsWithCounts`:
- `getProjectsForAdminUi`
- `getProjectsForInsights`

This mirrors the two places where the base query is actually in use
today and adapts the query to those two explicit cases.

The new `getProjectsForAdminUi` method also contains data for last flag
update and last flag metric reported, as required for the new projects
list screen.

Additionally the read model contains a private `getMembersCount` method,
which is also lifted from the project store. This method was only used
in the old `getProjectsWithCounts` method, so I have also removed the
method from the public interface.

This PR does *not* hook up the new read model to anything or delete any
existing uses of the old method.

## Why?

As mentioned in the background, this query is used in two places, both
to get data for the UI (directly or indirectly). This is consistent with
the principles laid out in our [ADR on read vs write
models](https://docs.getunleash.io/contributing/ADRs/back-end/write-model-vs-read-models).

There is an argument to be made, however, that the insights module uses
this as an **internal** read model, but the description of an internal
model ("Internal read models are typically narrowly focused on answering
one question and usually require simple queries compared to external
read models") does not apply here. It's closer to the description of
external read models: "View model will typically join data across a few
DB tables" for display in the UI.

## Discussion points

### What about properties on the schema that are now gone?

The `project-schema`, which is delivered to the UI through the
`getProjects` endpoint (and nowhere else, it seems), describes
properties that will no longer be sent to the front end, including
`defaultStickiness`, `avgTimeToProduction`, and more. Can we just stop
sending them or is that a breaking change?

The schema does not define them as required properties, so in theory,
not sending them isn't breaking any contracts. We can deprecate the
properties and just not populate them anymore.

At least that's my thought on it. I'm open to hearing other views.

### Can we add the properties in fewer lines of code?

Yes! The [first commit in this PR
(b7534bfa)](b7534bfa07)
adds the two new properties in 8 lines of code.

However, this comes at the cost of diluting the `getProjectsWithCounts`
method further by adding more properties that are not used by the
insights module. That said, that might be a worthwhile tradeoff.

## Background

_(More [details in internal slack
thread](https://unleash-internal.slack.com/archives/C046LV6HH6W/p1723716675436829))_

I noticed that the project store's `getProjectWithCounts` is used in
exactly two places:

1. In the project service method which maps directly to the project
controller (in both OSS and enterprise).
2.  In the insights service in enterprise.

In the case of the controller, that’s the termination point. I’d guess
that when written, the store only served the purpose of showing data to
the UI.

In the event of the insights service, the data is mapped in
getProjectStats.
But I was a little surprised that they were sharing the same query, so I
decided to dig a little deeper to see what we’re actually using and what
we’re not (including the potential new columns). Here’s what I found.

Of the 14 already existing properties, insights use only 7 and the
project list UI uses only 10 (though the schema mentions all 14 (as far
as I could tell from scouring the code base)). Additionally, there’s two
properties that I couldn’t find any evidence of being used by either:
-   default stickiness
-   updatedAt (this is when the project was last updated; not its flags)
During adding privateProjectsChecker, I saw that events composition root
is not used almost at all.
Refactored code so we do not call new EventService anymore.
<!-- Thanks for creating a PR! To make it easier for reviewers and
everyone else to understand what your changes relate to, please add some
relevant content to the headings below. Feel free to ignore or delete
sections that you don't think are relevant. Thank you! ❤️ -->

## About the changes

When reading feature env strategies and there's no segments it returns
empty list of segments now. Previously it was undefined leading to
overly verbose change request diffs.

<img width="669" alt="Screenshot 2024-08-14 at 16 06 14"
src="https://github.com/user-attachments/assets/1ac6121b-1d6c-48c6-b4ce-3f26c53c6694">


### Important files
<!-- PRs can contain a lot of changes, but not all changes are equally
important. Where should a reviewer start looking to get an overview of
the changes? Are any files particularly important? -->


## Discussion points
<!-- Anything about the PR you'd like to discuss before it gets merged?
Got any questions or doubts? -->
https://linear.app/unleash/issue/2-2518/figure-out-how-to-create-the-initial-admin-user-in-unleash

The logic around `initAdminUser` that was introduced in
https://github.com/Unleash/unleash/pull/4927 confused me a bit. I wrote
new tests with what I assume are our expectations for this feature and
refactored the code accordingly, but would like someone to confirm that
it makes sense to them as well.

The logic was split into 2 different methods: one to get the initial
invite link, and another to send a welcome email. Now these two methods
are more granular than the previous alternative and can be used
independently of creating a new user.

---------

Co-authored-by: Gastón Fournier <gaston@getunleash.io>
For easy gitar integration, we need to have boolean in the event
payload.
We might rethink it when we add variants, but currently enabled with
variants is not used.
Changes the event search handling, so that searching by user uses the
user's ID, not the "createdBy" name in the event. This aligns better
with what the OpenAPI schema describes it.
Encountered this case after encrypting an already long email address.
This should mitigate the issue in demo instance. I don't think it's a
big issue to ignore the length when validating an email address cause
this is already limited at the DB layer by the column length
Adds an endpoint to return all event creators.

An interesting point is that it does not return the user object, but
just created_by as a string. This is because we do not store user IDs
for events, as they are not strictly bound to a user object, but rather
a historical user with the name X.
Previously people were able to send random data to feature type. Now it
is validated.

Fixes https://github.com/Unleash/unleash/issues/7751

---------

Co-authored-by: Thomas Heartman <thomas@getunleash.io>
Changed the url of event search to search/events to align with
search/features. With that created a search controller to keep all
searches under there.
Added first test.
This PR adds Grafana gauges for all the existing resource limits. The
primary purpose is to be able to use this in alerting. Secondarily, we
can also use it to get better insights into how many customers have
increased their limits, as well as how many people are approaching their
limit, regdardless of whether it's been increased or not.

## Discussion points

### Implementation

The first approach I took (in
87528b4c67),
was to add a new gauge for each resource limit. However, there's a lot
of boilerplate for it.

I thought doing it like this (the current implementation) would make it
easier. We should still be able to use the labelName to collate this in
Grafana, as far as I understand? As a bonus, we'd automatically get new
resource limits when we add them to the schema.

``` tsx
        const resourceLimit = createGauge({
            name: 'resource_limit',
            help: 'The maximum number of resources allowed.',
            labelNames: ['resource'],
        });

        // ...

        for (const [resource, limit] of Object.entries(config.resourceLimits)) {
            resourceLimit.labels({ resource }).set(limit);
        }
```

That way, when checking the stats, we should be able to do something
like this:

``` promql
resource_limit{resource="constraintValues"}
```

### Do we need to reset gauges?

I noticed that we reset gauges before setting values in them all over
the place. I don't know if that's necessary. I'd like to get that double
clarified before merging this.
https://linear.app/unleash/issue/2-2501/adapt-origin-middleware-to-stop-logging-ui-requests-and-start

This adapts the new origin middleware to stop logging UI requests (too
noisy) and adds new Prometheus metrics.

<img width="745" alt="image"
src="https://github.com/user-attachments/assets/d0c7f51d-feb6-4ff5-b856-77661be3b5a9">

This should allow us to better analyze this data. If we see a lot of API
requests, we can dive into the logs for that instance and check the
logged data, like the user agent.

This PR adds some helper methods to make listening and emitting metric
events more strict in terms of types. I think it's a positive change
aligned with our scouting principle, but if you think it's complex and
does not belong here I'm happy with dropping it.
Add ability to format format event as Markdown in generic webhooks,
similar to Datadog integration.
Closes https://github.com/Unleash/unleash/issues/7646

Co-authored-by: Nuno Góis <github@nunogois.com>